Examples
These examples may be found in the “examples” directory included with the PyRF source code.
show_i_q.py
This example connects to a device specified on the command line, tunes it to a center frequency of 2.450 MHz then reads and displays one capture of 1024 i, q values.
#!/usr/bin/env python

import sys
from pyrf.devices.thinkrf import WSA4000

# connect to wsa
dut = WSA4000()
dut.connect(sys.argv[1])

# setup test conditions
dut.reset()
dut.request_read_perm()
dut.ifgain(0)
dut.freq(2450e6)
dut.gain('low')
dut.fshift(0)
dut.decimation(0)

# capture 1 packet
dut.capture(1024, 1)

# read until I get 1 data packet
while not dut.eof():
    pkt = dut.read()

    if pkt.is_data_packet():
        break

# print I/Q data into i and q
for i, q in pkt.data:
    print "%d,%d" % (i, q)
Example output (truncated):
0,-20
-8,-16
0,-24
-8,-12
0,-32
24,-24
32,-16
-12,-24
-20,0
12,-32
32,-4
0,12
-20,-16
-48,16
-12,12
0,-36
4,-12
plot_fft.py
This example connects to a device specified on the command line, tunes it to a center frequency of 2.450 MHz and sets a trigger for a signal with an amplitude of -70 dBm or greater between 2.400 MHz and 2.480 MHz.
When the trigger is satisfied the data is captured and rendered as a spectrum display using NumPy and matplotlib.
#!/usr/bin/env python

from pyrf.devices.thinkrf import WSA4000
from pyrf.config import TriggerSettings
from pyrf.util import read_data_and_context
from pyrf.numpy_util import compute_fft

import sys
import time
import math

from matplotlib.pyplot import plot, figure, axis, xlabel, ylabel, show

# connect to wsa
dut = WSA4000()
dut.connect(sys.argv[1])

# setup test conditions
dut.reset()
dut.request_read_perm()
dut.ifgain(0)
dut.freq(2450e6)
dut.gain('high')
dut.fshift(0)
dut.decimation(0)
trigger = TriggerSettings(
    trigtype="LEVEL",
    fstart=2400e6,
    fstop=2480e6,
    amplitude=-70)
dut.trigger(trigger)

# capture 1 packet
data, context = read_data_and_context(dut, 1024)

# compute the fft of the complex data
powdata = compute_fft(dut, data, context)

# setup my graph
fig = figure(1)
axis([0, 1024, -120, 20])

xlabel("Sample Index")
ylabel("Amplitude")

# plot something
plot(powdata, color='blue')

# show graph
show()
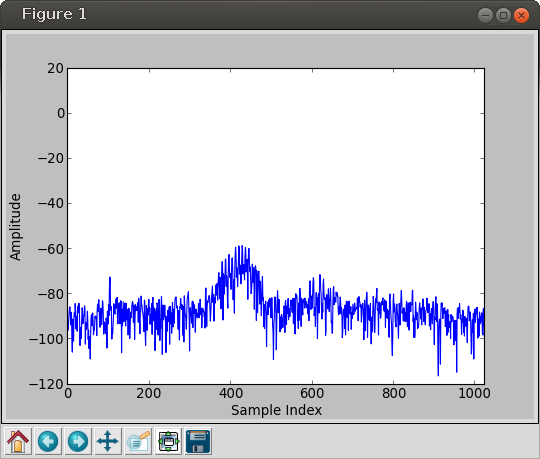
Example output of plot_fft.py
twisted_show_i_q.py
This is a Twisted version of the show_i_q.py example above.
#!/usr/bin/env python

import sys
from pyrf.devices.thinkrf import WSA4000
from pyrf.connectors.twisted_async import TwistedConnector

from twisted.internet import reactor, defer
import twisted.python.log

# connect to wsa
dut = WSA4000(connector=TwistedConnector(reactor))

@defer.inlineCallbacks
def show_i_q():
    yield dut.connect(sys.argv[1])

    # setup test conditions
    yield dut.reset()
    yield dut.request_read_perm()
    yield dut.ifgain(0)
    yield dut.freq(2450e6)
    yield dut.gain('low')
    yield dut.fshift(0)
    yield dut.decimation(0)

    dut.connector.vrt_callback = receive_vrt
    # capture 1 packet
    yield dut.capture(1024, 1)

def receive_vrt(packet):
    # read until I get 1 data packet
    if not packet.is_data_packet():
        return

    # print I/Q data into i and q
    for i, q in packet.data:
        print "%d,%d" % (i, q)
    # exit
    reactor.stop()

d = show_i_q()
d.addErrback(twisted.python.log.err)
reactor.run()